
Critical Strategic Information to Extend the TOC Replenishment Solution
Eli Schragenheim and Michael Demere
Executive Summary
This paper is written mainly for distribution to retail. Much of it applies to other kinds of distribution as well, and the text says where it applies fully and where only in part.
The central problem in managing any supply chain is uncertainty. Demand varies, supply varies, and the organization’s own internal variation adds to the difficulty of serving its customers reliably.
In retail the problem shows most clearly in the long tail: thousands of slow-moving items that tie up cash and shelf space and drag down the return on the inventory investment. Trimmed one sensible cut at a time, the tail slowly hollows out the very assortment customers come for. The usual tools offer no way out: the tail cannot be forecast, and stocking all of it cannot be afforded. So most distributors manage it by reflex, and lose ground they never see leaving.
The tail is a problem of uncertainty, and managing it significantly better is the single subject of this paper. Not forecasting it away, and not merchandising around it: how to manage the common recurring variation in demand and supply that every distributor lives with, item by item across the whole catalog.
There is a better way, and it is already well known. Eli Goldratt often observed that the TOC Replenishment Solution is the most powerful application of the Theory of Constraints, and yet the least implemented.
The question remains: why?
The solution itself is simple: hold inventory at the point of highest aggregation, and replenish frequently from actual consumption. Where implemented, the results are dramatic (better availability, less inventory, stronger cash flow), as Goldratt’s Isn’t It Obvious? demonstrates.
Yet the basic principles leave one practical question unanswered: protecting every SKU (Stock Keeping Unit) to the same degree is not economical, so a distributor needs a clear strategy for how hard to commit to each item, and the practical options that follow from that choice.
The real power of the Replenishment Solution is wider. It becomes complete the moment a distributor stops treating full availability as the default and starts choosing, deliberately and item by item, how much availability to commit to. The unlocking idea is simple and slightly uncomfortable: a stockout is not always a lost sale. When that is true, full availability becomes one option among three, and the solution reaches the entire catalog, tail included.
Several of the decisions this paper develops are, in the classical sense, marketing strategy: who is being served, what assortment serves them, how deeply to commit to categories and items. The paper treats them as strategic information because they sit upstream of replenishment: marketing as segmentation, assortment, and stock levels, not as advertising or promotion.
We arrived at the answer through direct observation. The Replenishment Solution works beautifully for fast- and medium-moving items with reliable supply. Extended to the long tail, or to unreliable supply, the inventory required to protect availability looked unreasonably high. Rather than accept the limitation, we asked: what would a complete, practical solution look like?
The answer starts where distributors already live: with uncertainty. Demand and supply vary, and that variation is not a forecasting failure waiting for better technology to fix. A forecast is a range, not a number. The practical response is a decision, made item by item, about how much availability is worth committing to, and the replenishment discipline to deliver it.
Two contributions make that possible.
Both rest on correcting one costly assumption: that a stockout is always a lost sale. Usually it is not, and once that is recognized, committing less than full availability for some items becomes sound strategy rather than failure.
The first is the recognition that not every item warrants the same commitment. Three named strategies make the choice explicit.
- Assured Availability commits to having the item in stock whenever a customer wants it, operationally close to perfect, for items where that commitment is justified.
- Reasonable Availability aims for the item to be usually available, accepting occasional stockouts as part of the deal.
- Limited Availability carries the item selectively, with no standing commitment, appropriate where surplus inventory itself poses real financial risk.
The error is not in choosing a less-than-perfect strategy for some items; it is in failing to choose deliberately.
That choice is made systematically rather than by instinct. For every item, four sequenced decisions are in play, with one prior question: what is the customer actually shopping for? First, should the item be sold at all? Some items do not earn their place. Second, if yes, should we invest to make availability perfect or near-perfect? That is Assured Availability. Third, if not, what level are we aiming for? That is the territory of Reasonable Availability, which is valid especially when the customer can easily buy another product instead. Fourth, where surplus inventory itself poses financial risk, how much do we keep of only what we are confident will sell before the value evaporates? That is Limited Availability. Every item falls into one of these four answers, and the contribution is making the choice deliberate rather than implicit.
These choices cannot be made in a vacuum. They depend on knowing whom the distributor serves, what it commits to delivering, and what its supply and finances can sustain. Without that context, decisions are made inconsistently, and individually reasonable decisions aggregate into strategic incoherence.
The second is that the commitment need not be made to an individual item at all. What the customer is shopping for decides where availability should be promised. Someone who wants Glenfiddich wants that bottle; someone who wants salt will take any of several; someone who wants a pair of jeans has come to choose from a range. Availability can therefore be committed at the level of a set: a Like Product Group, where one available member satisfies the need, or a whole assortment, where what must be protected is the richness of the choice itself. Buffers then work in two layers: items that the strategy wants to keep selling have their own buffer, while the set is held to a commitment of its own, and the set’s protection is the number of members it can offer. Many tail items that could never justify a standing commitment alone earn their place comfortably inside a set that offers a choice.
The stakes are significant. The long tail often represents half or more of a distributor’s SKU count while contributing a small share of revenue. Managed poorly, it consumes working capital, space, and attention. Managed well, it differentiates: it serves valuable segments, offers variety, and opens the way for new products and new tastes, completing the offering that drives loyalty.
Not all of this is new, and the paper is careful about which parts are. Much of the machinery (the Replenishment Solution itself, buffer management, the throughput frame) is established TOC, and the paper uses it as such. Three things are new, each filling a gap the established solution left open: the three availability strategies and the reasoning beneath them; two-layer buffering, which commits availability to a set rather than to an individual item; and the assortment managed as a counting buffer of variety. The body develops why each goes beyond what the Replenishment Solution already provided.
Distribution has always lived with this uncertainty. Managed deliberately rather than forecast away, it becomes an advantage few competitors capture.
The Key Challenge in Distribution
Managing the Common and Expected Uncertainty
The role of a distribution organization is to bridge what customers want to buy and what suppliers can provide, with both sides subject to considerable uncertainty. Most of the time the distributor has to guess the demand for specific products, taking supply time into account, while both demand and supply time fluctuate constantly. Managing this gap for thousands of items across many stores, where the demand for every item at every store has to be managed, is a real challenge.
Online shopping relaxes the challenge a little, but it makes customers wait, moving part of the uncertainty onto them. The need to purchase goods almost immediately still makes physical stores necessary.
The key tool in supply chains is forecasting. Whether produced by algorithms, AI, or human estimation, the forecast states what demand is going to be, so quantitative decisions can be made.
Yet one-number forecasts are unreliable even before considering rare events like a war closing supply routes. Common and expected uncertainty looks only at the normal, ongoing small happenings with non-dramatic impact on customer preferences, supply time, and product quality. Its defining trait: sometimes the different fluctuations accumulate, and at other times they cancel each other out.
Managing the common and expected uncertainty is a serious challenge, disrupting the bridge between demand and supply. And this is where the real opportunity lies: significantly better service than the competition, without taking high risks.
None of this criticizes how distributors have managed until now. Uncertainty is hard, and the goal is to give it a name and a structure. A distributor that recognizes it openly, judging a decision by the uncertainty it faced rather than by how it turned out and managing it more carefully than its competitors, turns what everyone lives with into a real advantage.
Where This Paper Applies
This paper uses distribution in its broad sense: buying goods and making them available to whoever needs them, without changing the product. A retail chain is a distributor under that definition. So is an industrial supply house, a pharmacy, a spare-parts operation and a wholesaler serving manufacturers. The paper is written mainly for distribution to retail, where the number of item-locations makes the uncertainty hardest to manage, but most of it applies wherever goods are bought in order to be sold again.
Within that definition, readers will recognize themselves in one of two situations, and the difference needs to be named at the start.
In the first, the customer chooses. Someone shopping for a hat, a book or a bottle of wine has a need that several products would satisfy, and part of what that customer is buying is the choice itself. A distributor serving that customer has to decide what variety to carry, and the risk of being short is that the customer finds nothing appealing.
In the second, the customer has already chosen. A manufacturer that has qualified one compressor for its refrigerator will not accept a different one. A contractor who has standardized on a particular carton sealing tape wants that tape, not an identical tape from another maker. Here there is no selection to manage. The distributor’s task is to have the specific item when it is asked for, and the risk of being short is that the customer is not served at all.
Most distributors live in both situations at once, in different proportions. A grocery chain is mostly the first, an industrial supply house mostly the second, and each has some of the other. The proportion decides which chapters carry the most weight for a given reader. Reasonable Availability, for instance, is typical of retail and rarer elsewhere; the chapters on Like Product Groups and assortments matter most where customers substitute.
What does not change with the proportion is the set of decisions that has to be made. In both situations demand and supply vary in ways no forecast removes. In both, someone has to decide how much stock to hold against that variation and what holding it is worth against what the item returns. In both, availability is a promise to the customer, and promising full availability on everything costs enough that it deserves to be a decision rather than a habit. Where a chapter applies only partially outside retail, the text says so at the point it happens.
What This Paper Does Not Cover
This approach applies mainly to distribution strategies that intend to replenish the items they sell, not to strategies where a sold product is never reordered. Two familiar examples make the boundary concrete. Some fashion retailers, Zara being the best known, buy a design once, sell it, and move on. Certain fresh fruits and vegetables behave the same way: available for a short window, then replaced by something else. Nothing here judges those strategies; they are simply built on a different premise.
The boundary is structural. Every mechanism in these pages (the stock buffer, buffer management, replenishing to consumption) presupposes the stock-buffer can be restored. Where there is no intention to reorder, there is no buffer to manage: the decision is a one-time purchase, not an ongoing commitment to availability.
Such strategies fall outside the item layer only. A retailer who never replenishes a particular garment still manages the richness of what hangs on the rack, refreshing it constantly with different items. That is a commitment at the level of the assortment, and the chapters on Like Product Groups and Managing Assortments apply to it directly.
The paper also sets aside several decisions that matter to a distributor but sit outside the question of uncertainty. It does not address the classification of an assortment by depth or breadth, or the life-cycle of an item, meaning when a product is emerging, at its peak, or reaching the end of its life. It does not address market segmentation, the choice of which customers to serve. And it does not offer a method for deciding which items belong in the catalog at all, or when a dead item, one that has lost its demand and will not regain it, should be dropped; the paper takes as given that such decisions must be made, and leaves the making of them to the people close to the market. These are real and important disciplines, and they are the established expertise of merchandisers and category managers, who generally know how to handle them. What that expertise does not resolve is how to manage the common and expected uncertainty around whatever assortment results. That, and only that, is the subject of this paper.
Forecasts Are Ranges
The real challenge in supply chain management is not how to forecast better; it is how to manage uncertainty. Uncertainty is a fact; a better forecast reduces it a little, but it does not go away. Many executives now expect AI to solve the problem, and AI is delivering improvements in inventory accuracy, supplier analytics, and short-horizon demand sensing. Those gains are real. But when AI is applied to forecasting while the logic still produces a single number, we are optimizing a flawed approach rather than fixing it. A single number gives no sense of how far actual demand might reasonably deviate from it, and that is exactly the information needed to decide how much to stock. A more sophisticated single number is still a single number. The ceiling on that kind of improvement is low. The limit is in the paradigm, not the math: until common and expected uncertainty is addressed, even the most advanced AI-assisted forecast gives a better wrong answer, not a different kind of answer.
We are largely blind to this. Organizations treat the forecast as if it were the demand rather than an estimated average of it. Plans are built on the number; performance is measured against it. When actual demand comes in different, the reaction is to question the forecaster, not the assumption that a single number was ever appropriate.
The mistake is easily demonstrated. A sales team forecasts demand for an item next month at 1,200 units; the supply chain system treats 1,200 as the plan; operations stocks accordingly. Actual demand might have been 798 or 1,426. The forecast was not wrong; 1,200 was only the average of a range that would have read 750–1,650. And since only 1,200 were stocked and all were sold, the higher demand was never even recorded. A specific number looks authoritative, and it is almost always wrong. The forecasting team did not do a bad job; the thing being forecast is not a number. It is a range.
Eli Goldratt made this point repeatedly and forcefully. A forecast, properly understood, describes the highest likelihood in a band of possible outcomes. The actual demand will fall somewhere inside that band, and the organization’s job is to be ready to respond wherever inside the band it falls, rather than to predict the spot.
The range has a shape that matters. The further from actual consumption, the wider the Forecast Range: a forecast for a week twelve months out is a wide band; for next week, a narrower one. That shape is a feature of how demand behaves, not a limitation of forecasting technology. The narrowing is not strictly monotonic: tomorrow’s band can be wider than the coming week’s, because daily fluctuations average out over a few days. Within any window, the relevant uncertainty depends on how the variation aggregates.
This is why response time matters so much. An organization that reacts quickly to actual consumption operates inside the narrow part of the Forecast Range, where uncertainty is containable. One that commits to a single-number plan far in advance operates in the wide part, where the commitment cannot match what materializes. Better forecasting does not close that gap; faster response does.
This raises the question of the forecasting horizon. A three-month forecast may seem more reliable than a two-week one. But when the reliable supply time is two weeks, replenishing what was sold is the right response to the actual uncertainty, and the three-month forecast serves no decision that has to be taken today.
Understanding uncertainty therefore means resisting the single-number forecast and working with the Forecast Range, with a horizon that matches the response time. The question changes from “what number will demand be?” to “what range is demand likely to fall within, and how quickly can we respond to wherever it lands?” This reframe is what makes the rest of the argument in this paper possible.
The effective way to handle uncertainty is to recognize it openly, understand the possible outcomes, and outline the rational options. No decision should be judged without understanding the uncertainty the decision maker faced. The gain is reaching new levels of success by handling uncertainty more effectively than the competition.
The Uncertainty That Cannot Be Solved
Organizations often approach future demand, most notably for the long tail, as a problem to be solved: better forecasting, more sophisticated algorithms, on the implicit assumption that enough data and analytical power can reduce uncertainty to acceptable levels.
The assumption is false for all items, and more so for tail items. The uncertainty is not a temporary condition to be overcome; it is a permanent feature of sparse demand. No analytical sophistication will tell you whether the specialty component that sold twice last quarter will sell three times next quarter or zero. The data does not contain that answer.
Acknowledging this changes the problem. The question is not “how do we predict demand for a specific item in a specific location?” but “how do we make good ordering decisions, especially for tail items, despite irreducible uncertainty?” Organizations that pursue prediction accuracy waste resources on an impossible objective; organizations that accept uncertainty and build decision frameworks around it make progress.
The Key Elements of the TOC Replenishment Solution
This paper expands the TOC application for distribution companies. Here we summarize the key elements behind the application.
The most important element is the stock buffer. The name already points to its role: protecting the availability of an item from fluctuations in both demand and supply. The buffer is defined for every item offered for sale, and it includes the on-hand stock available for sale plus the stock still on the way, including orders the supplier has not yet shipped.
The stock buffer is kept constant unless a clear decision is made to change its size, either because it fails too often to protect availability, or because too much of it sits on-hand for too long, meaning the buffer is too high.
Because the stock buffer is kept constant, every sale must be replenished as fast as possible. Usually, each day’s sales per item are accumulated and a replenishment request for that quantity is issued, keeping the buffer intact. The buffer operates like the ‘Min’ in the Min-Max practice: whenever the stock plus already-issued replenishment orders fall below the Min, a new order is generated. TOC recommends replenishing only up to the Min, the buffer size, without a minimum batch. Sometimes reality forces a minimum batch, but its necessity should always be checked.
Another key element is Buffer Management: ongoing control of the on-hand stock. While the stock buffer is kept constant, the on-hand part goes down with every sale and up again when replenishment arrives. Its purpose is to quickly note the cases where on-hand stock is so low that a shortage is imminent unless the replenishment arrives fast.
Buffer Management looks at the ratio ((Stock Buffer minus On-Hand) × 100 / Stock Buffer), the penetration into the buffer, or how much of it is not on-hand. This is the buffer status, measured for every item and location every day. Above 67%, with more than two-thirds of the buffer missing, the status is Red. At 33% or less the status is Green: a safe situation, maybe too safe. Between them the status is Yellow.
Operationally we expect to try to expedite the Red replenishment orders, in order to prevent shortages.
For a distribution chain, a key element is the prominent role of the central warehouse: much more inventory at the center, and fast replenishment from the center to the stores. Every store can then hold relatively small buffers, because its replenishment time is very short.
The central warehouse is replenished by suppliers, whose response is usually slower than the warehouse’s own replenishment of the stores or other downstream locations. But because the center covers the demand and supply uncertainty of the whole network, its accumulated demand fluctuates far less than the demand at any single store. Dealing with all the suppliers at the center, and feeding all the stores from actual sales, is what makes the common and expected uncertainty manageable.
This paper recognizes the huge power of the above solution, but also some situations where certain deviations should be used. On the way, we highlight the main challenge all supply-chains, definitely all distribution organizations, have to deal with.
Another key TOC term is throughput, similar to the accounting term ‘contribution’: the selling price minus the truly variable costs. For most distributors this is the margin: selling price minus the supplier’s price. In manufacturing and services the ‘margin’ is often reduced by other costs such as transportation, storage, and manpower; in TOC all not-truly-variable costs go into Operating Expenses, and net profit before tax is total throughput minus operating expenses.
A word about independence. Every aggregation in this approach, whether a central warehouse serving many locations or a Like Product Group serving one need, is protected by partial independence: what is short here is usually not short there at the same time. Full independence does not exist in real life, and neither does full dependence; the degree cannot be calculated and there is no need to try. Some dependency simply means somewhat less protection; how much, experience will show.
Three Groups of Products
For this conversation we will classify the potential set of products into three groups: the Fat Top, the Lessening Middle, and the Skinny Tail. This is a classification by how demand behaves, meaning how much and how steadily each item sells, not by revenue, by margin, or by the item’s stage of life, and it is distinct from the availability strategies introduced later.
These groups are not just points on a sales curve; they behave differently because the uncertainty behaves differently. The Fat Top sells fast and steadily, so demand averages out over each short replenishment cycle; the Skinny Tail sells rarely and erratically, so that averaging never happens and every unit of stock carries far more uncertainty per sale. That is why one availability rule cannot serve all three.
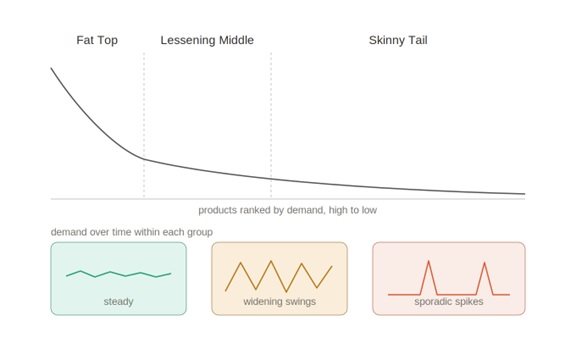
Figure 1. The three product groups along the demand curve, with the demand pattern typical of each.
The three groups might remind readers of ABC analysis, which allocates management attention across items. The difference is basic: the groups point to characteristics that should shape the inventory strategy, as developed later in this paper, while attention priorities in TOC are handled by Buffer Management: the computerized system manages every item from the most recent data plus the key strategy rules.
Others in the field describe a similar split under different labels; head, body, and tail are common. We use the more descriptive Fat Top, Lessening Middle, and Skinny Tail because the names point to the demand-and-supply behavior that drives the inventory strategy, rather than to position on a sales curve alone.
The Fat Top demonstrates the characteristics of high, regular “enough” consumption and certain “enough” replenishment of supply. These are the items where distributors, and also their suppliers, have a high desire to provide excellent ongoing availability, since a lost sale at the shelf is usually a lost sale for the supplier too. We should expect exceptionally high inventory turns: 25+ inventory turns should be a regular expectation.
Every competitor carries the same fast movers, and the resulting competition drives their per-unit throughput to the lowest in the assortment, sometimes to loss-leader levels. The Fat Top is therefore where a distributor is least differentiated; its value is stability, not competitive advantage. The possibilities to excel are much greater in the Lessening Middle.
The challenge begins with the Lessening Middle, where uncertainty in demand and resupply grows. These are items your customers demonstrably want, but with enough uncertainty to produce stockouts or periods of excess. The group is critical: its average margin per unit is usually higher than the Fat Top’s, where competition is fierce, and market shifts move demand sharply up for some members and down for others. The full bottom-line impact of this group is crucial, and the TOC practice of keeping excellent availability of every member while preventing excess inventory makes a true difference to profitability.
The greatest challenge is the Skinny Tail, including the decision which of these items to keep selling, and whether to keep them available at all. It is the hardest group to manage: providing availability for a Skinny Tail item means holding relatively high stock and waiting a long time for it to deplete. Yet these are the products that enrich the choice and attract customers, and losing those customers can be disastrous. So, some form of availability for slow movers is needed.
Demand for these items can be spiky and unpredictable, and vendor replenishment times are often unreliable, which makes any form of assured availability difficult and expensive. It is therefore common for distributors to abandon too many Skinny Tail products, sacrificing revenue even where customers want the items or the wider choice. Worse, every abandoned item is an opening for a competitor to gain a foothold.
The Skinny Tail sits at the heart of a chronic internal argument. Marketing advocates broad choice, more variety and more niche items, hoping to attract customers who would otherwise go elsewhere. Operations and finance push back on carrying cost, space, and working capital.
What is missing from this recurring conversation are two questions that would resolve it: for each Skinny Tail item, is it truly important to some customers, and if so, how much availability does it warrant?
Within the Skinny Tail items, we find items with truly erratic supply or short shelf life, where surplus must be scrapped at real cost. Such items are better handled selectively: carried without surplus rather than under a standing availability commitment.
The groups also differ in where the financial opportunity lives. The Fat Top consists of fast movers with consistent demand, which also makes it the most competitive group, with the lowest per-unit throughput (selling price minus truly variable cost). Its important characteristic is that it is the stable part of the whole business.
The Lessening Middle, by contrast, is where volume multiplied by per-unit throughput can be substantial. Managed well, the Lessening Middle is the group that produces the largest contribution opportunity, and for that reason it is, in many distributors, the most important group in the portfolio. It also calls for considerable management attention to keep excellent availability.
The Three Strategies for Availability
These strategies are a different axis from the three-group classification of Fat Top, Lessening Middle, and Skinny Tail. The groups are descriptive: they describe how an item behaves. The strategies are prescriptive: they describe what the distributor commits to. An item’s group does not dictate its strategy, and the two should not be conflated.
The three strategies are described here in retail terms. For a specialized distributor whose customers do not substitute, Reasonable Availability is rare and the choice is mostly between Assured and Limited; the reasoning is the same.
A simple and seemingly trivial assumption underlies most thinking about availability: what is not on the shelf cannot be sold, and one step further, any shortage causes a loss of sales. The logic is so widely accepted that it rarely gets examined, and it drives organizations toward an implicit goal of perfect availability across the entire assortment. Availability is a decision, not a default.
The logic is only partially true. Items that have already lost their demand do not reduce sales when short; they were not going to sell anyway. For items that do have demand, a stockout is a signal that a sale may have been lost, not evidence that one was. The customer who finds an empty shelf may keep a private buffer at home, take a substitute and think nothing of it, come back next visit, or leave disappointed and never return. The actual damage runs from zero to losing the customer and everything else they would have bought, and there is no clear way to measure where on that range any specific stockout fell. Stockout rates are measurable; the lost sales they produced are not.
This distinction carries the rest of the argument. If every stockout were a lost sale, the only rational strategy would be perfect availability, call it Assured Availability, for every item. Because most stockouts do not lose all the sales, the strategy dilemma is real. Some items earn the cost of Assured Availability because the customer-loss is severe enough to justify it: the rare customer who walks out for good carries more downside than the standing buffer costs. Others live comfortably under Reasonable Availability, available most of the time, because the typical response to an occasional stockout is substitution, deferral, or indifference. Still others belong under Limited Availability, holding little or no surplus, especially items with short expiration, where the customer understands and lives with it.
How critical is excellent availability across the assortment, then? Posed honestly, the question turns on two variables: the cost of providing excellent availability for the specific item, and whether the assortment offers natural substitutes, so that the customer would not be too disappointed by that item’s absence.
Before those decisions can be answered, a prior question has to be settled, because it determines what is being committed to in the first place: what is the customer actually shopping for?
Three answers cover most of what a distributor carries. Some customers come for a specific item, and nothing else will do; the shopper who wants Coca Cola Zero wants that particular item. Some come for a need that any of several items would satisfy, and are indifferent among them, as most customers are about salt. And some come to choose: the shopper looking for a nice hand watch expects to be presented with a range and to pick from it, and would be puzzled by the suggestion that one particular watch was the object of the trip.
The distinction matters because it moves what is being committed. For the first, the commitment is to the item, and the four decisions below apply directly. For the second, it is to the group, the subject of Like Product Groups. For the third, it is to the richness of the choice, the subject of Managing Assortments. Only in the first case is a specific SKU (Stock Keeping Unit) what the distributor is promising. Deciding which applies precedes all the other decisions, and like the tests that follow, it is a judgment made by people close to the customers, not a property of the product category. A particular single-origin coffee is a specific-item purchase for the enthusiast who wants exactly that roast, and an indifferent choice for the host who just wants a decent cup for guests.
The strategic frame can be made explicit. For every item the distributor might carry, four sequenced decisions are in play:
- Should the item be sold at all?
- If yes, should we make the full investment to ensure availability is perfect or near-perfect? If so, the item belongs under Assured Availability, and the rest of the approach (buffers, replenishment, governance) is tuned accordingly.
- If perfect availability is not warranted, what level of availability are we aiming for? This is the territory of Reasonable Availability, where the item is available at a level chosen to be good enough for its role, accepting that some stockouts come with it.
- For items where surplus inventory itself poses a financial risk (short expiration, obsolescence, items where being wrong on the upside dwarfs being wrong on the downside), how much do we keep of only what we are certain will sell before the value evaporates? This is Limited Availability.
Assured Availability demands holding considerably more inventory than the average forecast predicts, considering also the reliable supply time, and even expediting when demand is high and regular supply is slow.
Reasonable is much less demanding, still ongoing control is required to ensure good enough availability.
Limited Availability tries to prevent too high stock. Thus, while availability is still desired, the message to the customers is: “when you see, grab it.”
How the Item-Strategies Map to the Three Groups
The three item strategies are not a renaming of the Fat Top, Lessening Middle, and Skinny Tail. The product groups are descriptive: they characterize the demand and supply behavior of items. The strategies are prescriptive: they describe what the distributor commits to do about availability. The mapping between them is real but loose and the looseness matters.
The Fat Top, by definition, has steady demand and responsive supply: almost every Fat Top item belongs under Assured Availability, and the volume justifies the buffer. Lessening Middle items split: those with strong enough demand and tolerable supply earn the assured commitment, while the more variable ones are better served by Reasonable Availability than by over-investing. The Skinny Tail, meaning only those items the strategy wants to keep selling, splits between very few Assured, mainly Reasonable, and some Limited Availability. Strategically important items that signal expertise to priority customers may earn Assured Availability despite low velocity; items dominated by expiration or obsolescence risk belong under Limited Availability, where the carrying cost is honest about its bound; the rest, worth offering but not critical, belong under Reasonable Availability.
Two qualifications matter for how this gets applied.
The first is that the choice is per item, not per group. Two Skinny Tail items may receive opposite strategies because their strategic role differs.
The second is that new products default to Reasonable Availability during their evaluation period. The data does not yet support the stronger strategies, and the lighter commitment of Reasonable Availability is the right resting place while demand reveals itself. The default is still a decision, not a rule: a major launch backed by marketing commitments may warrant Assured Availability from day one, and a cautious experiment may deserve only Limited Availability until it earns more. Once enough is known, the item moves to Assured, stays at Reasonable, or drops to Limited based on what the data and the strategic role together suggest.
Every item the distributor carries falls under one of these three strategies. The act of naming the strategy, and of holding marketing, operations, and finance to a shared answer, is what allows the rest of this approach to do its work.
The Nature of Inventory Investment
Inventory investment behaves similarly to one’s investment portfolio, where selling some securities would be immediately followed by buying other securities using the cash freed by the sale. What truly matters is the worth of the whole portfolio and how it behaves over time.
Likewise, inventory investment does not go away when the stock sells. It is replaced. The buffer that supported the sale must be restored, which means another payment to a supplier, which means the cash commitment continues. From a financial standpoint, the relevant investment is the standing cost of the buffer, perpetually held in some form, replenished as it depletes.
This differs from a conventional capital investment. A distributor buys a sortation system for ten million dollars: a one-time outlay, ten or fifteen years of value through faster throughput, lower labor cost, fewer errors, then some residual value, or none. Return is calculated against the original outlay and harvested as the asset is used.
Real estate works similarly, with one variation: the asset typically retains substantial value. A ten-million-dollar building may be worth more or less ten years later, but rarely nothing; owners rent it during ownership and sell at the end, and return combines rental income with appreciation against the purchase price.
This distinction, between an investment that depreciates as it is used and an investment that stands as a continuing commitment, clarifies what return on investment means in the context of inventory.
Some big distributors have arrangements with their suppliers that reduce the impact of uncertainty. Some can return unsold stock to certain suppliers, and by that protect themselves from losing their investment. Some suppliers take full responsibility for their stock at the stores: they get their own shelf space and manage it themselves, so the stock buffers, the usually daily replenishment, and the investment in the inventory are all theirs. This is usually confined to some Fat Top items.
The financial arrangements between suppliers and distributors affect the cash-to-cash cycle. For very big distributors it can be negative: the supplier is paid after the items have been sold. Still, as long as the distributor has committed to pay for what it ordered, the stock is its investment, and if the stock does not sell, the distributor takes the loss. is its loss.
Annual Throughput Against Buffer Cost as ROI Measurement
For an item under TOC Replenishment, the ongoing investment is the cost of maintaining its buffer: inventory in the warehouse, stock in transit, and committed but not yet sent orders. The figure is roughly stable: the cash tied up in the item on a continuing basis. Transportation and storage are excluded, because they are usually not truly variable with the buffer quantity.
The return is the annual throughput the item generates: revenue minus truly variable cost, summed across all sales in the year. The ratio of annual throughput to buffer cost gives a clean comparative measure of how each item is performing relative to the cash it ties up.
Throughput accounting has long evaluated decisions by the throughput they generate against the investment they require. What has not been made explicit is an ongoing, per-item version of that comparison, the throughput a single standing buffer returns year after year, used to weigh items competing for the same working capital and to inform how much to commit to each one’s availability. That is what this measure makes explicit.
Consider a good, steadily moving item: a buffer of 500 units at $20, ten thousand dollars of standing investment. It sells 3,000 units a year at $10 throughput, thirty thousand dollars annually. The ratio is three to one: the item returns three times its standing investment every year. Healthy, if not outstanding, and the buffer cost is the right denominator, because it is what the distributor actually commits to keep this item available.
Now a Skinny Tail item: a buffer of 50 units at $40, two thousand dollars of ongoing commitment. It sells 40 units a year at $20 throughput, eight hundred dollars annually. The ratio is 0.4: the item returns forty percent of its standing investment per year. Recovering the buffer cost takes two and a half years, and at the end the buffer is still standing, still tying up the two thousand dollars that must be there for the item to be available at all.
This is not necessarily a bad item. It may earn its place through associated throughput, Like Product Group membership, or a strategic role with a priority segment. Associated throughput is the throughput an item pulls through for others: the obscure fitting that lets a contractor finish an entire order in one stop, or the specialty ingredient that keeps a household doing all its shopping with you, may post little on its own line while protecting much more. But the financial picture stays honest: the standing investment is real, it does not amortize away, and the ratio is the relevant comparison across items competing for the same finite working capital. Claims of associated throughput deserve respect, since they often reflect real knowledge held by people close to the market, but they are easy to invoke and hard to see. Before such a claim keeps an item alive, it should be checked rather than taken on faith.
This frame produces a useful question for every tail item: is the ratio it generates acceptable given the strategic role we have assigned to it? The ratio alone does not make the decision, but it gives the decision an honest financial floor.
The Total Investment as a Strategic Variable
So far, the frame has worked at the item level. But a distribution company does not invest only item by item; it invests across thousands of SKUs (Stock Keeping Units) in many locations at once and the strategically key figure is the total investment in inventory.
Under TOC Replenishment, total inventory investment is unusually well-behaved. Because every item is held against a buffer that stays fixed most of the time, the total settles into a steady state, changing only when the company adds items, removes them, or resizes many buffers on purpose. Managers can answer “how much money is committed to inventory right now?” without aggregating thousands of transactions.
This stability has a strategic consequence: total inventory investment can be an explicit decision rather than an emergent outcome. A company can decide how much capital it is prepared to commit to standing buffers, perhaps as a range allowing additions and removals, and hold the assortment and buffer targets accountable to that envelope. The total becomes a planned budget.
The complementary measure is total annual throughput against total inventory investment. The per-item ratio asks whether an item earns its place; the portfolio ratio asks whether the overall inventory position returns enough for the capital it consumes. They work together: the portfolio improves by tightening under-performers, removing items that fail their evaluation, or reducing buffers the system has shown it can run without, and each move shows up in both measures.
The total includes inventory in the warehouse, inventory in transit, and purchase orders committed but not yet received or paid. All three represent capital tied up in support of availability, and all three belong in the figure that drives strategy.
Inventory Investment and the TWO Critical Resources
Two resources require careful monitoring because inventory investment directly engages them: cash and warehouse space. Neither expands quickly. TOC sometimes calls them constraints; the more useful framing is critical resources, watched precisely so they do not become binding constraints. And again: the investment that engages them includes goods ordered but not yet arrived. A distributor who counts only on-hand inventory understates the actual commitment, sometimes substantially.
TOC Replenishment gives the distributor an unusual ability to manage these critical resources strategically. Because the total investment is relatively stable, with buffer changes far less frequent than in most non-TOC disciplines, the strategic questions become answerable: Is the current level about right, or could significant cash be released? Should investment expand to cover more of the assortment under stronger strategies, or be redirected? The same inquiry applies to space, certainly at the central warehouse and also locally. An unstable inventory level makes such monitoring nearly impossible; stability makes it routine.
The Portfolio in Numbers
A distribution company with thousands of items will have a mix of strategy assignments across its assortment, and the portfolio-level view shows what the mix means for both customer commitment and standing investment.
The following table shows three different items, each under the availability strategy that fits its group:
| Item example | Annual throughput | Stock Buffer | Buffer-to-annual ratio |
| Fat Top: a high-running grocery staple | $120,000 | $10,000 | roughly 1:12 |
| Lessening Middle: a regional specialty product | $24,000 | $4,000 | roughly 1:6 |
| Skinny Tail: a low-velocity specialty item | $4,000 | $4,000 | roughly 1:1 |
The Fat Top item turns its standing buffer roughly twelve times a year, the Lessening Middle item six, the Skinny Tail item once. Neither the investment nor the return is uniform, but each item’s strategy fits its group, and the portfolio reflects a chosen mix rather than an undifferentiated commitment to perfect availability for every SKU.
Consider now, what the working capital would gain from shortening the replenishment time to a mere three days, and how such an improvement changes the conditions for offering Assured Availability while dramatically reducing the investment in inventory.
The Risk in Committing to Availability
Every distribution company must purchase stock before it can be sold. Almost-perfect availability requires holding stock above the average forecast, covering the potential demand within the reliable replenishment time. With a perfect forecast the cost would be the goods alone and the return certain, but perfect forecasts are utopia.
Investing in inventory on uncertain estimates of demand and supply generates risk. The word “investment” is precise, and it carries the feature finance recognizes everywhere: any investment carries risk. Even buying for Reasonable or Limited Availability carries some; buying more than is predicted to sell within the reliable replenishment time, the essence of almost-perfect availability, carries more. The standing buffer is a standing commitment of capital, exposed in every period it remains.
So, the risk of providing Assured Availability has to be carefully weighed. The comfortable belief is that, if demand comes in low, the inventory will simply sell later. Often it will, but the buffer must still be evaluated against the risk of a sudden drop in demand, or of stock spoiling. Skinny Tail items managed for Assured Availability face this risk most sharply: a real chance of never selling the whole buffer, on top of the lower return the item generates.
Better, in the spirit of the saying often associated with Keynes (though the line traces more reliably to the logician Carveth Read), to beapproximately right than precisely wrong. A framework for managing availability cannot rest on the implicit assumption that perfect availability is the goal and falling short of it is failure. It must instead start from the recognition that availability has a cost, the cost is real risk, and not every item warrants the investment.
Like Product Groups
The strategies so far have been applied item by item, each item getting its own assignment from its demand pattern, strategic role, and customer relationship. Necessary, but it understates what is possible. Some items are not really independent products from the customer’s perspective; they are interchangeable members of a set. For such sets, the strategy decision can be made at the level of the set, with a substantially better economic result than treating each member as a standalone commitment.
A Like Product Group is a set of items that, from the customer’s perspective, are practically the same: if a customer would buy any member to satisfy the same underlying need, the items form a Like Product Group. The grocery customer needing sugar does not usually care which brand; the customer needing salt will accept any of the several kinds on the shelf; the contractor needing a particular grade and size of stainless-steel anchor bolt does not care which manufacturer produced it.
The customer’s perspective is what defines the group. Items the catalog treats as distinct may be one group to the customer; even customers used to a specific item, but who happily take another when it is missing, are shopping a Like Product Group. Conversely, items that look similar in the catalog may not be a group at all: a single-malt customer may hold brand preferences strong enough to put each brand in a group of its own. Likewise, a manufacturer may be able to produce a perfect product with a variety of raw materials but, out of concerns for quality, have only certified one of that set through their engineering team’s rigorous approval process.
A Like Product Group for some customers might not be one for others who look for a particular difference; some customers want only iodized salt, for instance. For most, though, the difference is not critical: one kind of salt being short does not dent the group’s sales, whereas being short of any salt at all disappoints many customers.
Deciding which items truly form a group is a judgment made by people close to the customers. The practical test is simple: when a member is missing, do customers here readily take another or do enough specifically want this one that its absence is a real loss? No one at headquarters can answer that reliably; the people who watch what customers actually do can.
Two-Layer Buffering
This chapter and the two that follow apply where customers substitute, or come to choose. A distributor whose customers have already chosen will find the item layer does most of the work.
What changes operationally when items are members of a Like Product Group is how availability gets committed and how buffers get sized. The commitment is made at the group level: the distributor commits that some member of the group is available whenever the customer wants the underlying product. The buffer logic operates in two layers.
The first layer is the group-level buffer. The commitment to have at least one member of the group available at all times means the group as a whole is being held to an Assured Availability standard. The group is short only when every member is short simultaneously, which happens far less often than any single member runs short. The protective buffer of the group is actually the number of different items in the group. Buffer Management checks the percentage of the of the group items that are short relative to the number of items in the group. Thus, the color of the group buffer would reflect the priority of replenishing some of the short items in order to have an adequate offering of the group. But which member should be prioritized to fast replenishment is not important, and it is up to Operations to make the decision.
The second layer is the individual-item buffer. Each member keeps its own buffer, sized to its own demand, supplier, and lead time, but its strategy can differ from the group’s. A specialty member with sparse demand may sit under Reasonable or even Limited Availability, its individual stockouts accepted because the group stays available through the other members.
This is what makes Like Product Groups powerful. A slow-selling specialty flour would be hard to defend under Assured Availability on its own; the standing buffer would tie up capital out of proportion to its throughput. As a member of the flour group it can be carried under Reasonable or Limited Availability, and its stockouts stop being a service failure as long as another member is available. The group commitment, we always have flour, holds even when the specialty member is short.
Implications for the Three Item-Strategies
Identifying Like Product Groups changes how the strategies map across the assortment. The group as a whole takes the strongest strategy that fits the underlying need, typically Assured Availability for a group core to the customer commitment, while individual members can carry any of the three, chosen to fit each member’s own demand and role.
A practical consequence: many Skinny Tail items earn their place as members of a Like Product Group when they could not as standalone items. The member contributes variety to a group committed at group level, its sparse demand supported by the group’s collective availability. This is how a distributor offers depth in a category, and the differentiation depth creates, without the working-capital cost of item-by-item Assured Availability.
Like Product Group should have half, or more, of its individual items, managed as Reasonable Availability, to ensure having good enough availability of the whole group.
Group-level commitment does not remove the need to watch particular members. A group counts as available only when its members are genuinely interchangeable for the customer. Where a specific member is the one customers keep asking for, its own availability still has to be watched on its own terms, not masked by the health of the group.
Recognizing that a Like Product Group offers Assured Availability as a group opens a wider use of the same layer: a whole category of products, with mixed item strategies, can be watched the same way, so that the available choice on any given day is never too small. A category showing very poor choice can damage the organization’s reputation. The group-level watch therefore extends beyond Like Product Groups to the availability level of whole categories.
Managing Assortments
The decisions so far have been about individual items: which to carry, with what commitment, and, when items are substitutable, whether to commit at group level. One further question sits alongside them and deserves its own treatment: how many items should constitute a category? Variety is itself a commitment to the customer, with pathologies on both ends.
Consider green teas. How many flavors should a grocer carry? One or two, even under Assured Availability, will not satisfy the customer who comes to browse; variety is part of what customers come for. Fifty may be worse: a hesitant or new customer can find the wall paralyzing and buy nothing at all. The same question runs through every category, from varieties of granola to cuts of chicken to men’s shirt designs in a season, with a different answer each time, but always in play.
Once named, the practical implication follows: the distributor must monitor per-category variety as well as per-item availability: is the count of available items within the range the customer expects? An assortment shrunk to too few, or grown to too many, is a quality-of-offer problem even when every item is meeting its strategy. And the two-layer buffering just developed is exactly the mechanism for it.
The Assortment as a Counting Buffer
That suggestion can be made precise, and doing so shows two-layer buffering is not only for substitutable items. A group buffer is a buffer whose units are members rather than units of stock: its size is the number of items in the set, decided by the strategy for that particular choice. It is consumed when members become unavailable and replenished by either the same items, or by new items. What separates a group from an assortment is the threshold, not the mechanic: how many members must be available before the set loses its attraction.
For a Like Product Group that threshold is one. The customer is indifferent, so a single available member satisfies the need, and the group fails only when every member is short at once. For an assortment the threshold is higher, because one available item does not constitute a choice. A rack holding a single pair of jeans is not a thin assortment; it is no assortment at all. Seen this way, a Like Product Group is simply the set whose threshold happens to be one, and an individual item is the further case of a set with one member. One mechanic, three settings.
The zones follow the same thirds as any buffer, counted in members. Most of the intended variety on display: green. Thinned: yellow. Fewer than about a third of the intended items available: red, too little choice for many customers. The color of each assortment signals the priority for replenishing it with new items. It should be simple enough to develop a software module that would monitor the number of available items of any assortment that is flagged as such, calculate the ratio and present the statuses of all assortments sorted according to their colors: Red, Yellow and Green.
As with the average of the Forecast Range, a third is a starting point rather than a fixed rule; the point at which a particular category stops looking like a choice is a judgment for the people who watch customers make it.
The decided number itself needs to be understood for what it is: a maximum intention, not a daily standard. Sales remove members and replenishment restores them, so the actual count breathes below the intended one; on many days the full number will simply not be there, and that is not a failure. The commitment to variety is, in effect, Reasonable Availability applied to the assortment: half the intended choice may still be a perfectly good choice. What the counting buffer manages is that breathing; it does not demand the full number every day, it signals when the thinning has gone far enough to need attention.
A rack of sixty jeans styles, where thirty is still good enough, must not drift to twenty, where the choice stops meeting the customer’s standard. A displayed buffer status of 67%, forty styles missing out of sixty, makes the high priority for adding styles clear to the logistics managers.
Replenishing an assortment is not quite the same act as replenishing an item: a member can be restored with its own stock, or replaced by a different member altogether, because what is being restored is variety. This is precisely how the strategies set aside at the beginning operate: the retailer who never reorders a garment still keeps the rack full of choice with different garments. Such a distributor has no item layer to manage; it has only this one.
The Operational Rules and Buffer Management
The previous chapter established the three availability strategies as explicit choices about each item. Naming the strategy is only half the work; the operational system that runs it day to day determines whether the commitment holds. This chapter develops that system: how buffers are sized, how replenishment runs, when to expedite, when to adjust, and how the system stays honest about what it delivers.
The principles are common across all three strategies. The discipline they enforce differs by strategy. The chapter takes the principles first, then walks through how each strategy applies them.
Buffer Sizing Across the Three Item-Strategies
Buffer sizing follows the strategy choice in a clean way. The Forecast Range is the relevant input: any item’s expected demand over its replenishment time is not a single number but a band, with an upper bound, a lower bound and an average. The band covers what seems to be reasonably possible. The strategy determines which point in the band the buffer is sized to cover. How the bounds themselves are estimated, whether from sales history corrected for periods of shortage, from analytics, or from the forecasting team’s judgment, is the forecasting discipline’s own craft, and this paper does not prescribe an algorithm. Its contribution is the decision layer above whatever method is used: what each availability commitment means, and which point of the band it covers.
Assured Availability: the buffer covers the upper bound of the Forecast Range over the replenishment time. The intent is that even an upper-end fluctuation does not deplete the buffer before the next replenishment arrives. The standing investment is correspondingly higher, but the strategy demands it.
The forecast behind the buffer has to cover the replenishment time, and since that time is itself variable, the reliable replenishment time is the right horizon. If supply usually arrives within one to two weeks, use two: the question becomes how much demand could arrive in the next two weeks. The upper yet reasonable end of that range is the recommended buffer size for Assured Availability.
Reasonable Availability: the starting point is the average of the Forecast Range over the reliable replenishment time, which is, in effect, the level conventional ‘min–max’ inventory practice already reorders around. This is a starting point, not a fixed target. It is tuned by judgment and observation: if the availability it delivers looks good enough for the item’s role, it stays; if not, the buffer is moved up into the band toward fuller protection, or, where surplus is the greater risk, down toward the lower bound. Because Reasonable Availability items are given replenishment priority, though never expedited, the availability actually achieved sits above what holding only the average might suggest. The standing investment is meaningfully lower than Assured.
Limited Availability: the buffer covers only up to the lower bound of the Forecast Range. The intent is that the buffer reflects only the demand the distributor is confident will materialize before the item’s value declines, the shelf life expires or obsolescence catches up. Stockouts are frequent and expected; the customer message (“when you find it, buy it”) is honest about this.
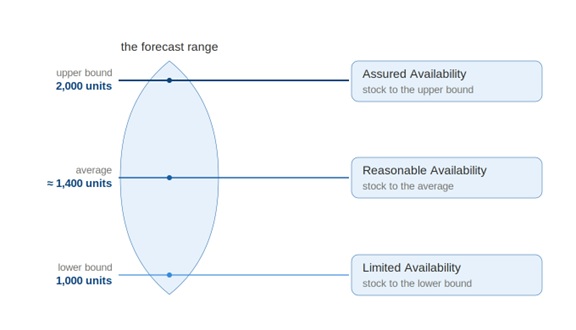
Figure 2. Stocking to the Forecast Range: the three availability strategies and where each sets the buffer.
A worked numerical example below makes the three buffer sizes concrete for a single item across the three strategies.
Consider a single item with an average demand of 100 units per day and a replenishment time of 14 days. The Forecast Range over the replenishment time runs from a lower bound of 1,000 units to an upper bound of 2,000 units, with an average around 1,400 units. The same item, under each of the three item strategies, produces three different buffer sizes, and three different standing investments. The numbers below are illustrative.
| Strategy | Buffer size | Buffer covers | Standing investment at $5/unit |
| Assured Availability | 2,000 units | Upper bound of Forecast Range | $10,000 |
| Reasonable Availability | 1,400 units | Average of Forecast Range (starting point) | $7,000 |
| Limited Availability | 1,000 units | Lower bound of Forecast Range | $5,000 |
The same item under Assured Availability ties up twice the working capital of the same item under Limited Availability. The customer commitments differ accordingly. The annual throughput against buffer cost ratio, developed later in The Nature of Inventory Investment, is what makes the standing investment legible against the return.
Replenishment Is the Shared Mechanism
This point is easy to lose: replenishment and fast response are the operational mechanism for all three strategies. Limited Availability does not mean “no replenishment,” and Reasonable does not mean “loose replenishment.” The key is a fixed buffer per item (or Like Product Group), covering the on-hand stock, the stock in transport, and open orders to the supplier. A sale of eleven units triggers a request or purchase order for eleven. The buffer holds the same size from day to day, unless an explicit decision changes it.
Assured Availability does not mean “tight replenishment of a kind the other two do not get.” Every item the distributor chooses to carry, regardless of strategy, is held against a buffer, depleted by actual consumption, and replenished based on what was consumed. The basic mechanic does not change.
What changes is the parameters: how big the buffer is, how the size is chosen, and what triggers operational action. Those parameters reflect the strategy. The mechanism does not.
The Critical Role of Buffer Management Priority System
The replenishment move itself should run as frequently as possible, from the central warehouse, a local warehouse serving the area, or the supplier, to every store. In most distribution chains this means thousands of different items, replenishing what was sold the day before.
In practice the daily transport often cannot move everything sold yesterday, because capacity of people or vehicles falls short or the source itself lacks inventory. So, a priority system is needed: which items must go today, and which can safely wait for tomorrow’s transport.
Buffer Management, using the buffer status ((Buffer minus On-Hand)/Buffer), paints that priority by color: Green least, Yellow medium, Red highest. Which raises the question: when an Assured Availability item is Red and still cannot be transported today, what then? For such cases an Expediting Policy has to be in place.
Expediting Policy
Expediting, meaning accelerating a replenishment when on-hand stock is at risk, is a real operational tool with real costs: money, management attention, supplier pressure, and the risk of becoming the default rather than the exception. The policy on expediting should follow the strategy, not the buffer color alone.
Assured Availability: the commitment is that the item is available whenever the customer wants it, so a buffer trending toward depletion, a Red status, warrants a check whether expediting is called for. While the item is Red, the replenishment may already be on its way and no action is needed; in other cases a special transport must be initiated to prevent a shortage.
Reasonable Availability: do not expedite as a routine action. The strategy already accepts occasional stockouts; a depleting buffer is information that the buffer may need adjustment, not a trigger for urgency. Since Reasonable Availability covers a large share of most assortments, treating every warning as an alarm would generate continuous urgency at a cost the strategy does not justify. Practically, a Reasonable Availability buffer needs only two colors: Green up to 50% penetration, Yellow above it. No Red!
Limited Availability: do not expedite. The strategy is built on the recognition that surplus inventory poses real financial risk, and expediting would defeat the purpose. Replenishment runs normally, without buffer management. Whether the buffer is good enough is judged by data analysis: the number of days the item was short, and the cost of expired items scrapped.
Buffer Adjustment Over Time
Buffers are not static. Demand patterns change, supply conditions shift, and a buffer that was correctly sized last quarter may be wrong this quarter. The system should adjust, but the adjustment discipline matters as much as the adjustment itself.
The principle: do not make small changes. A 5% or even 15% adjustment to a buffer is below the noise floor of demand variation. It costs operational attention to implement, produces no visible benefit, and trains the system to fiddle. The minimum adjustment threshold should be 20%, large enough that the change reflects a real signal in the demand or supply data, not statistical noise.
One caution governs every adjustment: the sales record doesn’t always reflect the demand record. When an item was short, the system recorded no sale, but the absence of a recorded sale does not mean the absence of demand. Reading raw sales through a period of poor availability creates a dangerous loop: low availability suppresses recorded sales, the lower recorded sales appear to justify a smaller buffer, and the smaller buffer produces more stockouts. Before the data drives any adjustment, it is critical to consider whether shortages prevented demand from being fully satisfied and correct the record for those periods.
Assured Availability is a commitment made by the distribution company to its customers. When an Assured Availability item is short, even for just one day, that commitment has been violated! So, an analysis of what caused the shortage has to be carried out. The decision on the table is whether to increase the buffer, because of either too high a fluctuation in the demand or a delay in the replenishment, or to wait for more cases, in order to maintain the stability of the system. When the cause sits on the supply side, the diagnosis matters even more, because the failure can be structural: a supplier losing its grip, a central warehouse that has moved to less frequent shipments or a failure of operations. Where the shortage was caused by a delay in replenishment despite a Red buffer status, managerial action is expected, to ensure such a delay is not repeated.
Dr. Goldratt developed the Dynamic Buffer Management (DBM) algorithm, based solely on the daily buffer statuses recorded within the replenishment time. DBM answers when a buffer change is called for; by how much it should change was never resolved, because that answer requires reading what actually changed, the demand or the supply or both, and estimating by how much. This is where AI can improve on the algorithm: recommending not only when to change the buffer, but by how much, and pointing to cases where a tighter management of operations is called for. It is important to remember: the appropriate stock buffer is impacted by the uncertainty in both the demand and the supply. This makes it a worthy target for AI, especially for the buffers of Assured Availability items.
But the AI analysis must also consider the requirement for stability. This means recommending a change only when the data suggests a movement of 20% or more in either direction, not a 7% twitch in the moving average! This is a lesson that AI has to consider: respond to signal, not to noise. The threshold makes the signal recognizable. We assume both Goldratt and Prof. Deming would agree.
One boundary on the AI’s role needs stating. An algorithm extrapolates from what it has seen, and a novel disruption is precisely what it has not seen: were the Strait of Hormuz to close and block supply for weeks, no history of buffer statuses would tell the system what that event means. Reading a disruption of that kind, and deciding what it demands, remains human judgment. The AI watches the common and expected uncertainty; the exceptional kind still belongs to management.
For Reasonable Availability items, the occurrence of a shortage is normal, on the assumption that all, or most, of the customers find a good-enough substitute in the available assortment. For a distributor whose customers do not substitute, this check does not apply and the item belongs under Assured or Limited. That key assumption, that a shortage of a Reasonable Availability item does not cost the sale, has to be checked. The check belongs at the level of the assortment, not the individual item: as long as the availability of the assortment is good enough, say more than a third of the members are available, daily sales should be about the same as when the assortment is fully, or nearly fully, available. This can be checked statistically, by comparing the assortment’s sales in periods when its availability was relatively poor against periods when it was relatively good. When a certain level of shortages visibly pulls the assortment’s sales down, the response is to widen the assortment, or to increase the buffers of the members that matter most to customers. The same check can reveal the opposite: the assortment may simply be too big. With, say, only half the members present, sales may even improve, because a smaller choice is easier to choose from.
Here also a key underlying rule should be employed: any change should be significant. Small and frequent changes are not effective for managing the real-life common and expected uncertainty.
Measuring What Each Item-Strategy Actually Delivers
The system should inquire whether each item-strategy delivers the expected value, so new management decisions can be evaluated and eventually made. A good performance measurement would be useful.
For Assured Availability items: track the actual stockout rate; the measurement asks whether Assured Availability is in fact happening. A persistent stockout rate above near-zero signals an undersized buffer.
For Reasonable Availability items: track how often the item is actually available. The strategy expects stockouts, but the strategy also has a useful availability target: most of the time. A Reasonable Availability item that is available 75% of the time is performing as the strategy intends. An item that is available 30% of the time is signaling that the buffer is undersized.
For Limited Availability items: track whether surplus is being avoided. The measurement asks whether the standing buffer depletes reliably before it ages, expires, or obsolesces; consistently accumulating surplus signals an oversized buffer. The opposite failure also exists: no scrapped items, but availability below, say, 10%, a buffer too small for the item’s role.
These per-group measurements keep the system honest over time, and they are the data that justifies each strategy assignment to finance, operations, and the executive team, by showing that each strategy is doing what it claims.
Application to Specialized Distributors
The three strategies fit retail-oriented distribution well: grocery, fashion, hardware, where the distributor serves a large anonymous customer base. They also fit specialized distribution, such as parts for older car models, specialty industrial supplies, and contractor materials, but there the operational form can look different, and the difference needs to be named.
Specialized distributors typically know their customers. A customer looking for a specific part for an older car model is rarely substitutable, but often willing to wait if the wait is bounded and predictable: “I can have it for you in two weeks” is acceptable in a way that “we usually have it; sorry, we’re out today” is not. Reasonable Availability fits awkwardly here: the cost of an unexpected stockout to the relationship is high, while the cost of an honest order-on-demand commitment is low.
TOC readers will recognize the manufacturing parallel: Make-to-Availability (MTA), items always kept in stock, and Make-to-Order (MTO), items produced on customer order with a known lead time. The same distinction serves specialized distribution: always-stocked items are the equivalent of MTA, Assured Availability, while items sourced on customer order with an honest lead-time commitment are the equivalent of MTO. Committing to a lead time, of course, requires supply reliable enough to stand behind it.
The strategic logic (commit, partially commit, or do not commit to standing inventory) does not change for specialized distributors. What changes is the operational expression of “do not commit.” In retail, Limited Availability typically means carrying the item selectively; in specialized distribution it often means an explicit order-on-demand arrangement with a clearly communicated lead time. Both are honest, and both honor the same decision: commit something other than standing inventory to this item.
For the Skinny Tail items a specialized distributor cannot economically hold alone, two operational answers preserve availability without a standing buffer at every location. The first is accumulation. Where the network spans a large area with a central warehouse, the Skinny Tail can be stored only at the center and shipped to a store when a customer order arrives, an effective, doable MTO solution. And where several distributors serve the same need (spare parts for older car models is the classic case), they can pool those slow movers at a single shared location, where the combined demand makes affordable Assured Availability none of them could justify alone.
The second is fast response: rather than stock the item, commit to replacing it quickly, a make-to-order arrangement with a short, dependable supplier, often just a few days. For the customer who needs a part for an old model, a reliable three-day delivery is rarely a lost sale. Both answers express the principle running through this paper: availability is managed by holding stock, by accumulating it where demand aggregates, and by responding fast where it does not, with the buffer sized to whatever availability the item’s strategy calls for.
Seasonality and Operational Adjustments Needed
Some items have seasons. Their demand pattern is not the steady distribution that buffer sizing assumes by default but a predictable rise, peak, and fall over a defined window. The underlying logic does not change for these items, but several operational adjustments are necessary to handle them well.
Buffers must be increased before the season begins, because the off-season buffer will be depleted quickly once it starts. Time the increase close to the season, according to the replenishment time. Earlier accumulation ties up cash and warehouse space unnecessarily (necessary in manufacturing, where seasonal capacity is the constraint, but distributors do not need that lead time); later accumulation risks running out at the season’s start, when customer expectations are highest.
Within the season, some commitments may shift when shelf space becomes an active constraint at the peak. The seasonal fast-movers get intensified focus to maintain availability, and several Reasonable Availability items may need an Assured-style operation, because this is precisely when they are sought, while other Reasonable items in the category may receive less commitment than usual while space is tight.
The items that peak are usually a recognizable subset, the seasonal fast-movers, whose demand rises sharply for the window and subsides. They justify the pre-season increase and the in-season attention: they carry the bulk of the season’s throughput, and a stockout at the peak is a stockout at the moment the customer most expects the item. The rest of the seasonal category can stay on its normal strategy; raising those buffers in step would tie up cash and space the season does not repay.
End-of-season demands the opposite adjustment: reduce the raised buffers back to their previous level one replenishment time before the expected end. Shipments arriving at the season’s close become Limited Availability items by default, surplus that should never have been ordered. Ordering steadily through the season’s tail leaves leftovers competing for space and tying up cash all off-season.
Because the peak pressures warehouse space, the season should be planned explicitly, with shelf space for seasonal and non-seasonal items alike. With the increase timed close to the start and the drawdown well before the end, the peak is absorbed without disrupting the rest of the operation.
Transportation and Replenishment Flow
Availability commitments require good control of the physical movement of inventory that sustains them. Earlier chapters covered what to commit to and how to size and adjust the buffers; this chapter covers how the goods actually move and how transportation choices either sustain or undermine the strategic commitments the distributor has made.
Assured Availability depends on the ability to move inventory where it is needed, sometimes urgently. Local buffers thin under demand spikes, and the central warehouse must be able to send emergency shipments when they do. The cost of emergency transportation is part of the cost of the commitment. A distributor who balks at emergency shipment costs and lets local stockouts persist is committing to Assured Availability only conditionally and the customer experience reflects it.
Central-warehouse replenishment and selling-point replenishment are different mechanisms with different rhythms. The center replenishes from suppliers: its demand, aggregated across all selling points, is more predictable but supplier lead times can run to weeks domestically and many months for imports and specialty items. The selling points replenish from the center: local demand is choppier, since one sales event can drain a local buffer, but the center’s replenishment should be short and predictable, sometimes a single day. Buffer sizing differs accordingly: central buffers cover the long supplier time over steadier aggregated demand; selling-point buffers cover the short central time over local more variable demand.
Supplier relationships are inseparable from transportation. How fast will the supplier ship if asked? Will it accept emergency orders? Small quantities quickly, or only full pallets or even truckloads? The answers shape central-warehouse buffer sizing: a supplier who ships a small emergency order in two days permits a smaller central buffer than one who ships on a four-week schedule. The supplier-side question is part of the replenishment design.
The ‘minimum batch,’ so prominent in manufacturing, is also critical to fast replenishment between the central warehouse and the local distribution centers or stores. Any minimum order quantity can delay replenishment and indirectly affect buffer sizing. Sending ten units to cover a two-unit sale may be justified by the right package size, protection in transit or loading efficiency but the resulting problems must be weighed: more trucks, or shipments delayed for lack of them, and DCs or stores forced to hold more than the buffer, pressing on limited space.
Transportation policies, including the minimum transport batches, should be developed, and periodically re-evaluated, with one clear purpose: making the response to any sale at any store fast enough to sustain the required availability.
Transportation frequency is a strategic choice with costs on both sides. More frequent replenishment reduces local buffers but raises transport cost; less frequent does the opposite. The right frequency is not the one that minimizes cost: more frequent replenishment shortens replenishment time, which improves availability from the same or smaller buffers, winning sales that would otherwise be lost. The real comparison is added transportation cost against the throughput better availability produces, plus the cash freed by smaller buffers. Treating transportation purely as a cost to minimize undermines strategic commitments made elsewhere.
Transportation connects directly to the critical resources discussed in the chapter on inventory investment: faster, more frequent transportation frees cash by reducing the buffer each location needs, but transportation is not free either and the right arrangement balances both against the strategic commitments the distributor has made.
Conclusion: Turning Uncertainty into Advantage
The argument of this paper compresses into a few sentences. Demand and supply are uncertain; a forecast is a range rather than a number, and the honest response is a system that replenishes against actual consumption and holds buffers sized to the uncertainty each item carries. Because a stockout is not necessarily a lost sale, not every item deserves the same commitment: three named strategies, Assured, Reasonable, and Limited Availability, make the choice explicit, four sequenced decisions place every item under one of them and a standing financial measure keeps each choice honest about the capital it ties up. The error was never in choosing a less-than-perfect strategy for some items; the error is in not choosing deliberately. Availability is a decision, not a default.
Not all of this is new. Much of what the approach relies on (the Replenishment Solution itself, buffer management, the throughput frame, the treatment of cash and space as critical resources) is established TOC. The contribution is to organize it into a way of managing availability on purpose, and to add the few new pieces where the existing solution ran out. Each closes a specific gap. The three availability strategies give the distributor a way to commit, on purpose, to less than full availability, which the Replenishment Solution, built to protect every stocked item, never offered; this is what lets the solution reach the tail. Two-layer buffering commits availability to a set rather than an item, either a Like Product Group, where one available member is enough, or a whole assortment, where the richness of the choice itself is what must be protected, so that slow items which could never justify a standing buffer alone earn their place inside the set. The assortment managed as a counting buffer, whose units are members rather than units of stock, extends buffer management to variety, a quantity it had never measured. These are the claims the paper stands behind; everything around them is the established solution, used as such.
The cost of not making these choices deliberately is rarely dramatic, which is exactly what makes it dangerous. Two patterns recur.
The account that went quiet. A regional contractor who had been a reliable customer for years gradually reduced their purchases. When a sales rep finally asked, the answer was revealing: “You used to have everything we needed. Now we never know what you’ll be out of. It’s easier to consolidate with a supplier we can count on.” No one had decided to stop serving contractors. Individual item cuts, each defensible on its own, had aggregated into a weaker assortment that no longer met the customer’s needs. The customer did not complain. They simply left. An explicit commitment to a customer segment prevents this, because each item decision can then be weighed against whether it serves the customers the company has chosen to serve.
The slow erosion of identity. A distributor that had built its reputation on depth (“if we don’t have it, it doesn’t exist”) found that reputation fading. No one had decided to become a shallow generalist. But years of tail pruning, each round justified by velocity metrics and margin thresholds, had gradually hollowed out the assortment. Longtime customers noticed; new customers never knew what the company had once been. A market position the company had built over decades eroded through a thousand small decisions, none of which felt consequential at the time. Making the strategic role of each category and item explicit prevents this, so that depth-as-competitive-position is preserved rather than chipped away one velocity report at a time.
Consider the distributor that made the shift. Facing the same eroding tail, it stopped pruning by velocity and instead gave every item an availability strategy: Assured for the few hundred (or thousands when the full offering is > 15,000) items its chosen customers counted on, Reasonable for the broad middle, and Limited, sourced on order rather than stocked, for the long tail it had been abandoning. Total inventory did not climb; it moved, out of overstocked slow movers and into the buffers that protected the relationships that mattered. The contractors who had been consolidating their purchases elsewhere came back, because what they needed was on the shelf again and the space freed from dead tail stock funded deeper coverage where coverage paid. Nothing about the demand had changed. Only the decisions had.
These costs are paid by distribution companies every year, in revenue lost to competitors and in market positions that erode. No approach will make every uncertain decision turn out well; uncertainty guarantees that some will not. What this approach prevents is the silent cumulative loss that comes from managing the tail without one.
None of this comes free, and the approach has requirements and limits. It rests on reliable consumption data; replenishing against what actually sold is only as good as the signal of what sold. It works best where inventory can be aggregated, at a central warehouse or pooled location that lets demand average out before it is committed to a shelf and it asks more of networks that cannot. Above all it takes discipline: an availability commitment means nothing if a slow-item flag is allowed to cut it. A flag can prompt a review; it does not, on its own, change the strategy; only a re-decision does. An item being slow is not in itself a reason to drop it from Assured Availability; that is precisely the reflex an explicit commitment exists to prevent. And it is built for the uncertainty distributors live with every day, the ordinary, recurring variation in demand and supply, not the rare, dramatic shock.
Where to begin is simpler than it sounds. Sort the catalog by how demand behaves, what averages out and what does not, rather than by volume. That sorting sets the starting point, not the strategy: an item whose demand never averages out can still earn Assured Availability when its role justifies the cost. Give each of the three groups its availability strategy. And start where it matters most: the handful of items the customers you have chosen to serve count on you to have. The rest follows from there.
That is what this paper has been about. Distribution has always lived with common and expected uncertainty. The distributors who treat it as something to be named, structured, and managed, rather than forecast away or absorbed by reflex, are the ones who turn the uncertainty everyone faces into an advantage few capture.

